

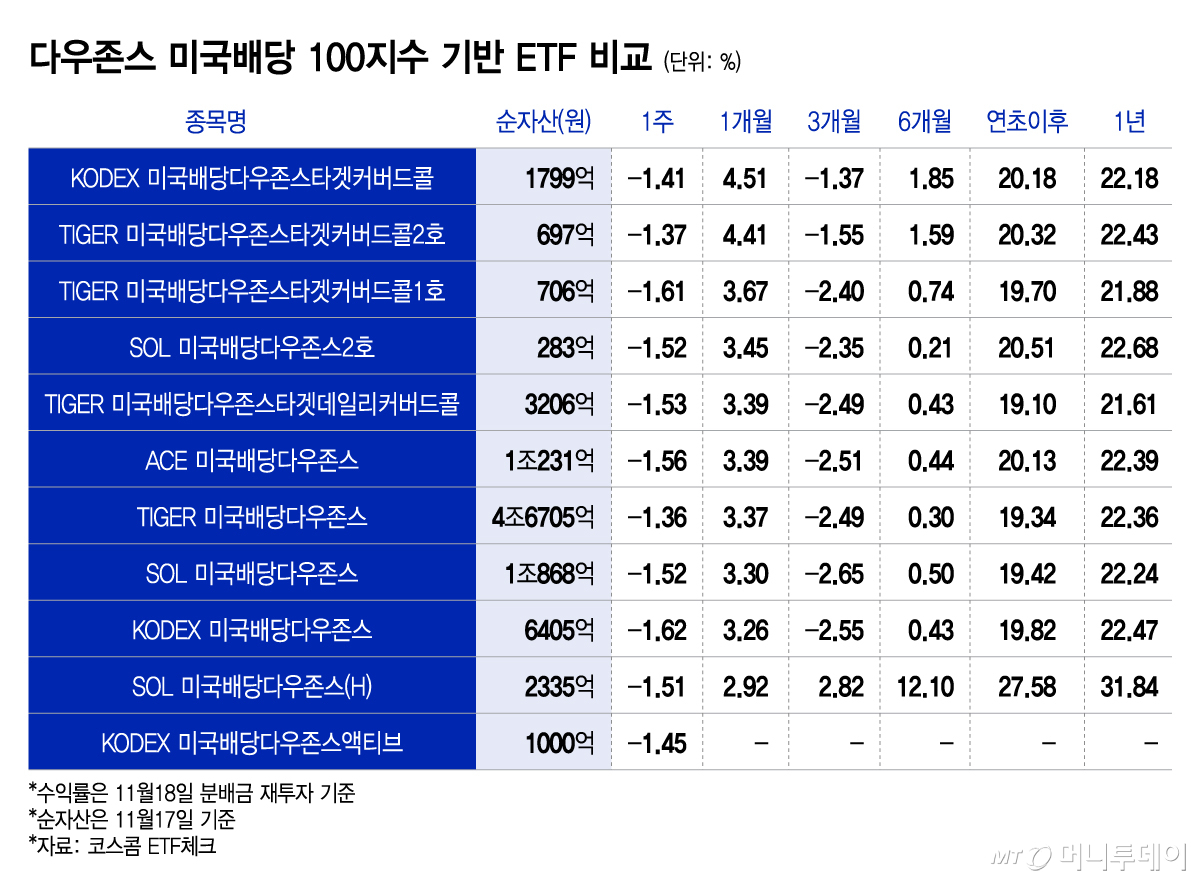
As volatility in domestic and global stock markets has increased, popularity is rising for US Dividend Dow Jones ETFs (Exchange-Traded Funds) that invest in representative U.S. dividend growth stocks. These ETFs track the same index as the representative U.S. dividend growth ETF "SCHD" (ticker symbol), earning them the nickname "Korean version of SCHD." However, even when tracking the same index, returns differ depending on factors such as covered call strategies, currency hedging, and whether the fund is active or passive.
According to KOSCOM ETF Check and Korea Exchange data from the 19th, there are 11 US Dividend Dow Jones ETFs listed domestically. While these ETFs are based on the same index, their returns varied significantly. This is because asset management companies have continuously launched products incorporating strategies such as covered calls, currency hedging, and active management, in addition to passive ETFs that simply track the underlying index. On the 20th of last month, the "KODEX US Dividend Dow Jones Active" was also listed.
Looking at returns over the past month (based on reinvestment of distributions) as of this date, covered call ETFs generally showed higher returns. The return for the "KODEX US Dividend Dow Jones Target Covered Call" was 4.51%, the highest among the group.
Following that were: "TIGER US Dividend Dow Jones Target Covered Call No. 2" (return of 4.41%), "TIGER US Dividend Dow Jones Target Covered Call No. 1" (3.67%), "SOL US Dividend Dow Jones No. 2" (3.45%), "TIGER US Dividend Dow Jones Target Daily Covered Call" (3.39%), and "ACE US Dividend Dow Jones" (3.39%).
The relatively high returns of covered call ETFs are due to the nature of their strategy. Covered call ETFs sell the right to buy underlying assets at a specific price (call options) to earn premium income, which is then used for distributions. US Dividend Dow Jones covered call ETFs hold a portfolio based on the US Dividend Dow Jones Index while selling S&P 500 call options. Over the past month, the US Dividend Dow Jones Index rose by approximately 2.8%, while the S&P 500 Index fell by approximately 4.1%. Consequently, these funds were able to fully benefit from the rise in dividend stocks while also capturing premiums from selling call options.
Strategies differ even among covered call products. The KODEX US Dividend Dow Jones Target Covered Call tracks an index aiming for annual premium generation of 10%. The TIGER US Dividend Dow Jones Target Covered Call No. 2 and No. 1 use indices pursuing annual premium generation of 7% and 3%, respectively, as their underlying benchmarks. Returns vary by ETF due to differences in call option allocation.
In contrast, the year-to-date return was highest for the "SOL US Dividend Dow Jones (H)" at 27.58%. This is 8.48 percentage points higher than the return of the TIGER US Dividend Dow Jones Target Daily Covered Call (19.10%) over the same period.
Chun Ki-hoon, Team Leader of the ETF Consulting Team at Shinhan Asset Management, stated, "The SOL US Dividend Dow Jones (H) is the only US Dividend Dow Jones product that employs a currency hedging strategy." He added, "It has recorded relative performance superiority by minimizing exchange losses due to the strong won amid recent trends in the decline of the won/dollar exchange rate." He further noted, "This demonstrates that managing the performance of the won/dollar exchange rate is as important as the performance of the underlying assets when investing in U.S. dividend growth stocks."
Experts in the financial investment industry advise that investors should examine factors such as strategy, net asset size, currency hedging status, and trading volume, even among US Dividend Dow Jones ETFs.
Lee Jung-hwan, Managing Director of the Strategic ETF Management Division at Mirae Asset Global Investments, said, "The actual burden cost includes all associated costs incurred by an ETF, such as trading commissions and index licensing fees, which ultimately affect investor performance." He added, "These associated costs decrease as the size of the ETF increases, so investors should choose products with large scale and high trading volume."
As of the 17th, the ETF with the largest net assets was the "TIGER US Dividend Dow Jones," recording 4.6705 trillion won. Following that were: "SOL US Dividend Dow Jones" (net assets of 1.0868 trillion won), "ACE US Dividend Dow Jones" (1.0231 trillion won), and TIGER US Dividend Dow Jones Target Covered Call No. 2 (697 billion won).


 in STOCK

