

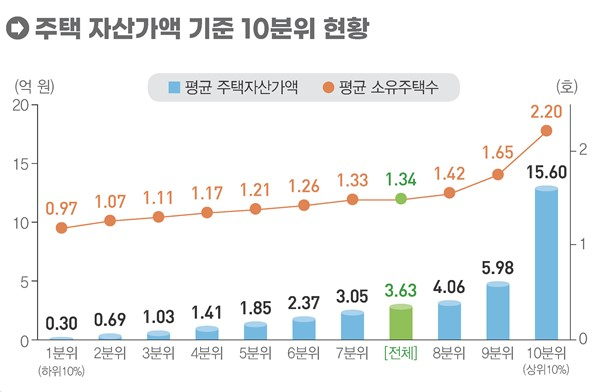
The gap between the top and bottom 10% of housing assets has exceeded 50 times. This means that the average housing asset value of households in the top 10% is more than 50 times that of households in the bottom 10%.
This disparity has been widening year by year recently, indicating that polarization in the housing market is intensifying.
According to the "2025 Housing Ownership Statistics" released by the National Data Agency on Monday, the average housing asset value for households owning homes was 363 million won, an increase of 0.3 billion won from the previous year (333 million won).
Last year, the average housing asset value for the 10th decile (top 10%) was 1.56 billion won, up by 220 million won (16.4%) from 1.34 billion won in 2024. In contrast, the average housing asset value for the 1st decile (bottom 10%) remained unchanged at 0.3 billion won compared to the previous year.
As a result, the ratio of the average housing asset value between the 10th and 1st deciles reached 52 times last year. This represents a continuous increasing trend when compared with 40.5 times in 2023 and 44.7 times in 2024.
Last year, the average number of homes owned by the 10th decile was 2.2 units, and the average housing area was 110.7 square meters. For the 1st decile, the average number of homes was 0.97 units, and the average housing area was 62.8 square meters.
Among 22.495 million general households last year, 12.965 million households (57.6%) owned homes, a 2.2% increase from the previous year. Among home-owning households, 3.374 million households (26.0%) owned two or more properties.
The number of individuals owning homes was 16.306 million, an increase of 330,000 people (2.1%) from the previous year. By age group, those in their 50s accounted for 25.0% of the total.
This was followed by those in their 60s (23.1%), 40s (19.7%), 70s (13.3%), and 30s (9.1%). The average number of homes owned per person among home owners decreased to 1.06 units from the previous year (1.07 units).
The number of individuals owning two or more homes was 2.421 million people (14.8%). This ratio decreased by 0.1 percentage points compared to the previous year.
The regions with the highest proportion of multi-home owners were Jeju (19.9%), Chungcheongnam-do (17.4%), and Gangwon-do (17.2). The age groups with the highest proportion of multi-home ownership were those in their 60s (18.1%), 50s (18.0%), 70s (15.0%), and 40s (13.8%).
The number of people who were non-home owners in 2024 but owned homes last year was 791,000. Among them, 17,000 people acquired two or more properties. During the same period, 351,000 people changed from home owners to non-home owners.
Compared with 2024, the number of people whose housing ownership count increased in 2025 was 1.07 million. The number of people whose ownership count decreased was 590,000.

 in ECONOMY
